NMR technology in the field of petroleum geology has gone through several important stages. The first stage is the use of NMR relaxation time (T1, T2 relaxation time) to qualitatively study the physical characteristics of the reservoir. The second stage is one-dimensional spectra calculated by mathematical inversion (such as T2 relaxation time spectrum) to quantitatively characterize reservoir properties. Particularly, the measurement methods conventional reservoirs has been continuously improved. The third stage, people continue to develop multi-dimensional spectrum technology to overcome the shortcomings of one-dimensional spectrum, wherein the two-dimensional spectroscopy is the most representative (such as the two-dimensional spectrum of diffusion coefficient D-T2 relaxation time, two dimensional spectrum of T1-T2 relaxation times and so on). Combined one-dimensional and two-dimensional of NMR spectroscopy with MRI detection technology, it could reflect more fully the core properties and other important information. Research analysis technology is mainly about NMR T2 relaxation spectrum, the two-dimensional spectra of diffusion coefficient D-T2 relaxation time and core of MRI. The oil mined changed from conventional oil reservoirs to unconventional reservoirs (tight sandstone, etc.). And at the same time, the exploitation of the reservoir from the shallow to the deep transformation. NMR core analysis technology is constantly developing: Based on the characteristics of deep oil reservoirs of the core. NMR technology in the interpretation models and inversion algorithms has done a corresponding improvement and simultaneous detection equipment are constantly improved to adapt to low SNR and high sensitivity requirements of the deep reservoir about core.
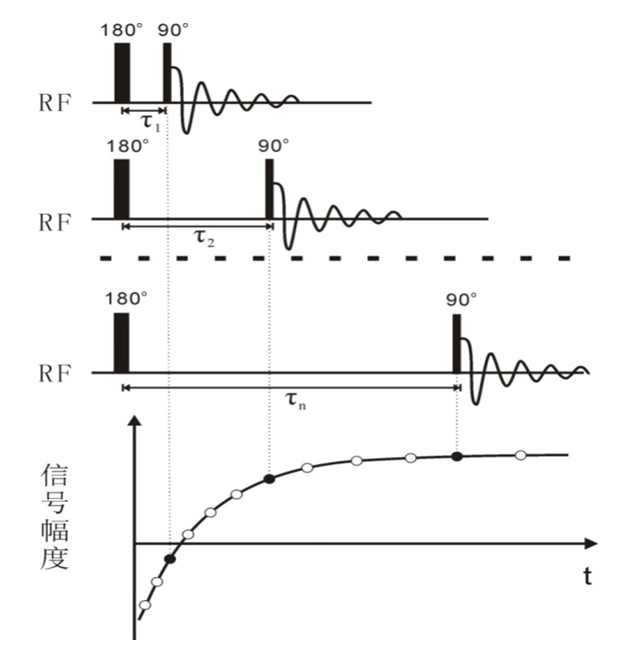
1. T1 relaxation time and its measurement
T1 relaxation of longitudinal relaxation is also called spin - lattice relaxation. After the RF pulse, the system has been restored after the relaxation to equilibrium with the role of the main magnetic field. Proton spin will transition from the high energy level to a lower energy level and release energy at the same time. (1) From the formula, M_z = M_0 [1-2e ^ (- t / T_2)],we know that longitudinal component rise to a maximum value form according to the index. Wherein T1 is characterized constant, which is called T1 relaxation time. The reverse - recovery method is the most frequently used method to measure the longitudinal relaxation time T1. The sequence of RF pulses is shown in Fig 1.
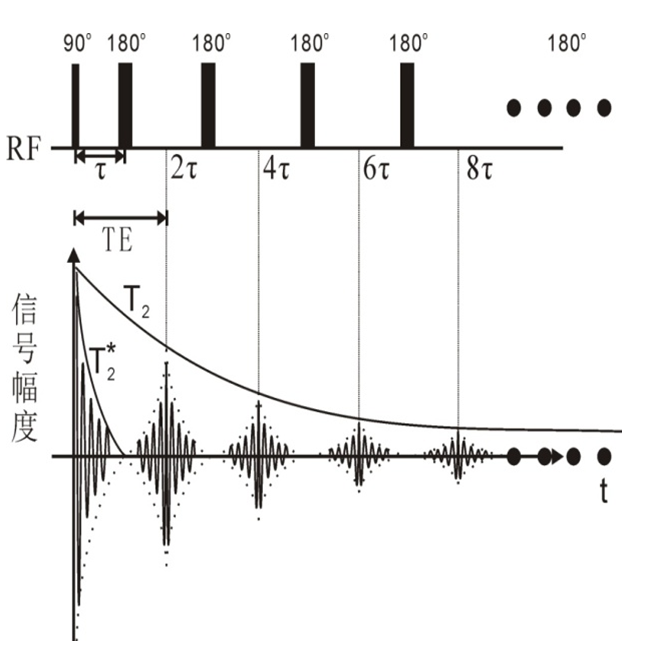
2. T2 relaxation time and its measurement
T2 relaxation of transverse relaxation is also called spin-spin relaxation. The relaxation of the transverse component of the macroscopic magnetization vector decays to zero. In terms of the microscopic, the transverse relaxation is the process that phase of the spin system change from focus to divergent. The total energy of the system does not change, but the internal energy of spin exchange between the hydrogen nuclei. After the RF pulse, the transverse component of the magnetization vector in the macro-exponential decay. T2 is characterized constant T2, which is called the T2 relaxation time. T2 is measured usually CPMG sequence. The RF pulse sequence which is shown in Fig 2.
3. NMR T2 relaxation spectrum
We use NMR technology to measure fluid cores and the echo signal we obtained is multiple fluids relaxation signals by superposition , as shown in Figure 3.
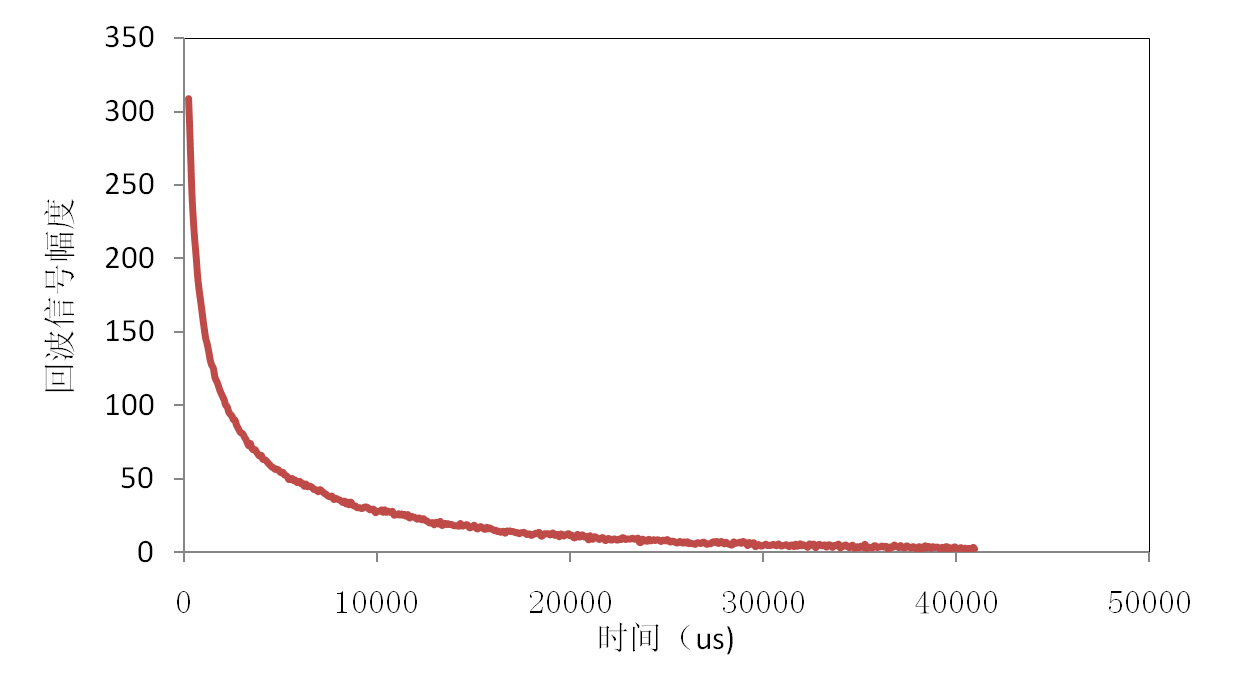
Figure 3 The NMR echo signal
Firstly, we establish signal attenuation interpretation model: rock hearts of every pore fluid line with all single exponential decay, different pore size of the pore radius corresponding to different characteristic time constant denoted T_2i, the total signal measured can be expressed as a constant characteristic of different relaxation Yu weighted superposition satisfies the equation:

, Wherein, T2i is characterized relaxation constant, Ai is the weight.
Figure 5 shows four different fluids relaxation characteristic constants. A, B, C, D corresponding to the relaxation rate of the fluid from large to small, so corresponding features time is from small to big. According to the formula (1.2-7), it can fit the curve shown in Fig echo signals to obtain the different characteristics of the fluid relaxation constant weight. In practice, the different characteristics of constant inversion process is generally more than four and mostly we will choose 64 or 128 to achieve the best fit results.
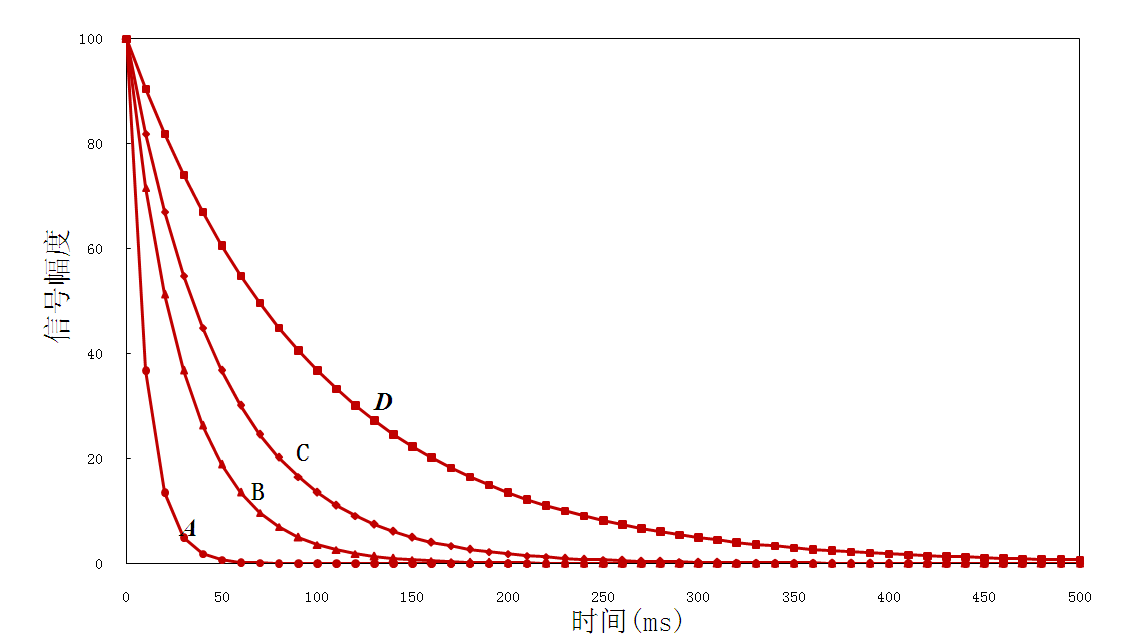
Figure 4 Different characteristics constant fluid relaxation
We can get T2 relaxation time spectrum through mathematical based on the mathematical model. The abscissa is NMR T2 relaxation spectrum and the ordinate is different characteristics corresponding to the constant weight,as shown in Figure 5. 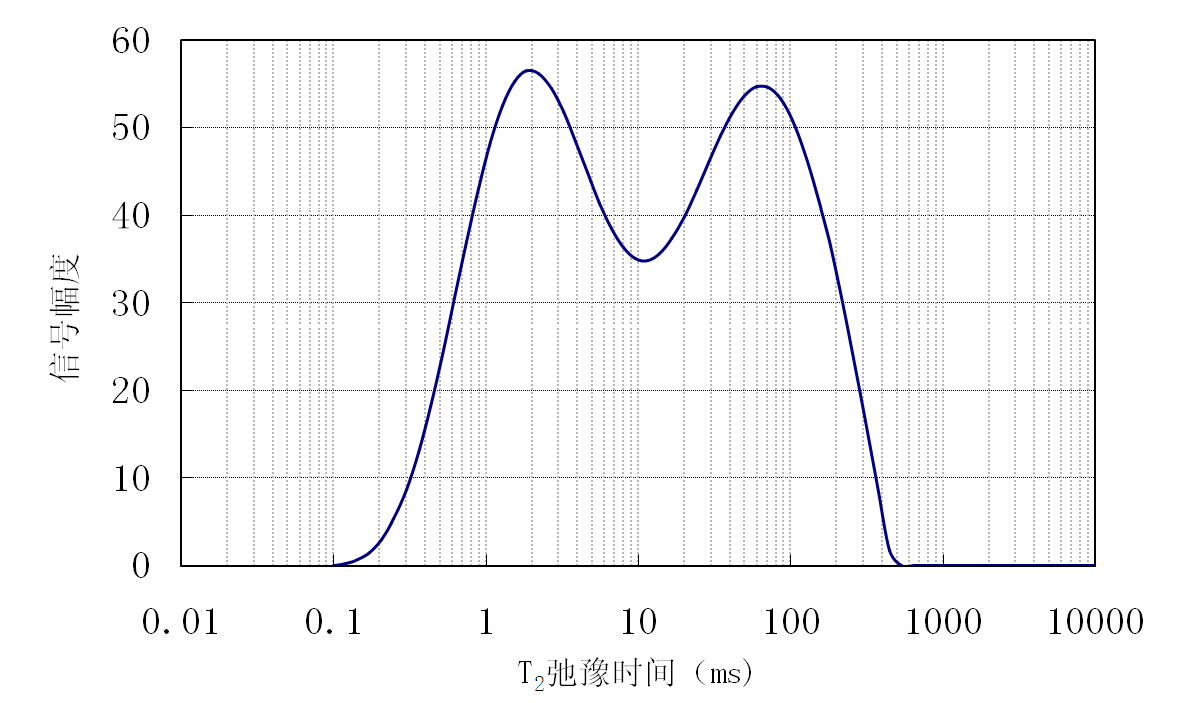
Figure 5 NMR T2 relaxation spectrum
4. D-T2 NMR spectrum (pulsed magnetic field gradient method, PFG method)
This section describes the NMR spectrum of D-T2 (PFG, Pulse Field Gradient) theoretical knowledge, including NMR measuring method, measuring parameters, inversion method and algorithm.
Although the one-dimensional spectrum (relaxation spectrum and diffusion spectrum) has been made great success in the analysis of the core nature, but a single parameter or a one-dimensional spectrum, often not fully reflect the nature of the core and the distribution of oil and water in the core, and one-dimensional spectrum can’t be very clear distinction between oil and water. In recent years there has been a wide variety of two-dimensional spectrum technology, which can fully reflect the cores as well as the distribution of oil and water wettability and other information. These technologies mainly includes diffusion-relaxation dimensional spectrum, T1-T2 -dimensional spectrum, T1-dimensional chemical shift spectrum. These two-dimensional spectra greatly improve the ability to distinguish between oil and water, provides information about the fluid nature of the cores, in particular the diffusion-relaxation dimensional spectrum, achieved good measuring results both in pulsed field gradient and constant gradient field, in the actual production associated with the petroleum logging has achieved remarkable results. Research of diffusion-relaxation dimensional spectra in water saturation, water distribution, wettability and other aspects have made great results never achieved in the past one-dimensional spectrum technology.
Since the inner core permeability unevenness is large, the stronger the magnetic field inhomogeneity inside the core (built-in gradient), the stronger the NMR signals of the additional interference is more serious. Therefore most of the cores can be measured relaxation times and diffusion coefficient at low field conditions in order to avoid the influence of a strong magnetic field inhomogeneity to the measurement results. The low-field NMR condition is generally low signal intensity and higher requirements on MRI instrument accuracy, stability, SNR have put forward. In this study, the MRI researching team from EECS, Peking University research and development of NMR system in a magnetic field uniformity, the probe dead time, gradient strength and other aspects have reached the international advanced level. Porosity, water saturation, permeability measurements have achieved good results, and can obtain stable and accurate one-dimensional relaxation spectrum and diffusion-relaxation dimensional spectrum.
The diffusion-relaxation dimensional spectra technique simultaneously get the diffusion coefficient and the relaxation time distribution of the test sample, which requires the pulse sequence used in the process can measure the diffusion coefficient and the relaxation time two species parameter measurements in the same time, and the instrument measured by the observed signals having different signal component of diffusion coefficients and relaxation times resulting from the superposition, and there need to establish an accurate and fast inversion algorithm to obtain the required two-dimensional spectrum from the observed signal. After obtained diffusion-relaxation dimensional spectrum, we extract key information to reflect the distribution of water and oil in the core through appropriate data processing and theoretical analysis, and lay the foundation for further study of transport processes and enhanced oil recovery.
5. The introduction of Online NMR Testing device
Nuclear magnetic resonance (NMR) is widely used in pore structure, fluid saturation distribution of oil and gas seepage experimental study in recent years. The technology is based on the nuclear spin magnetic moment relaxation and the principle of diffusion in the rock. Through the relationship of establishment of nuclear magnetic variables and rock - calibration fluid information. quantitative detection can be conducted online within the core pore size and distribution of the fluid. And it has the advantages of fast, repeatable and high precision.
Mechanism of high temperature and pressure and flow-line nuclear magnetic resonance test device mainly comprises NMR measurement system, flooding the system and confining pressure system, the core holder for NMR, computer control and data processing systems.
Test device as described above, the experimental study of gas-water-line multiphase fluid flow mechanisms at high temperatures and pressures can be used.
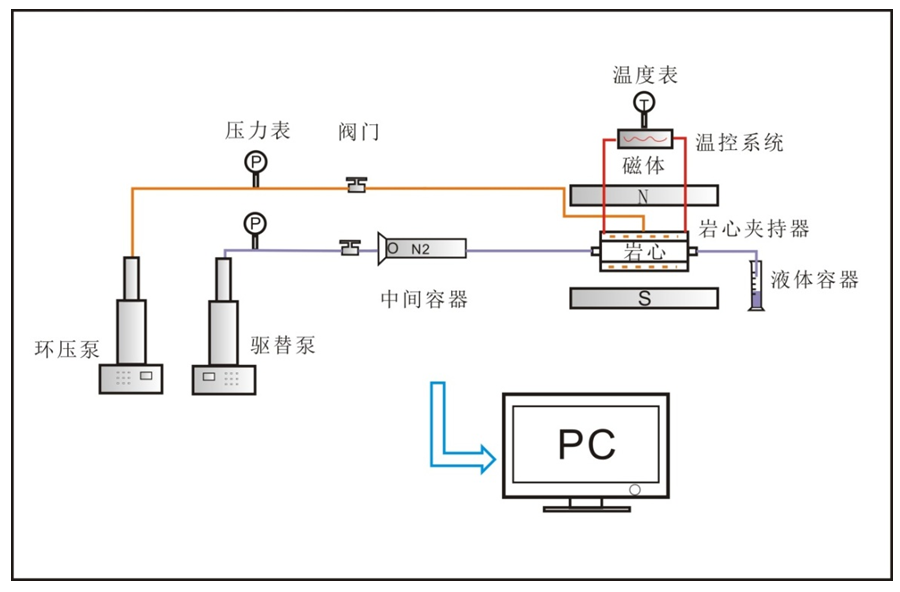
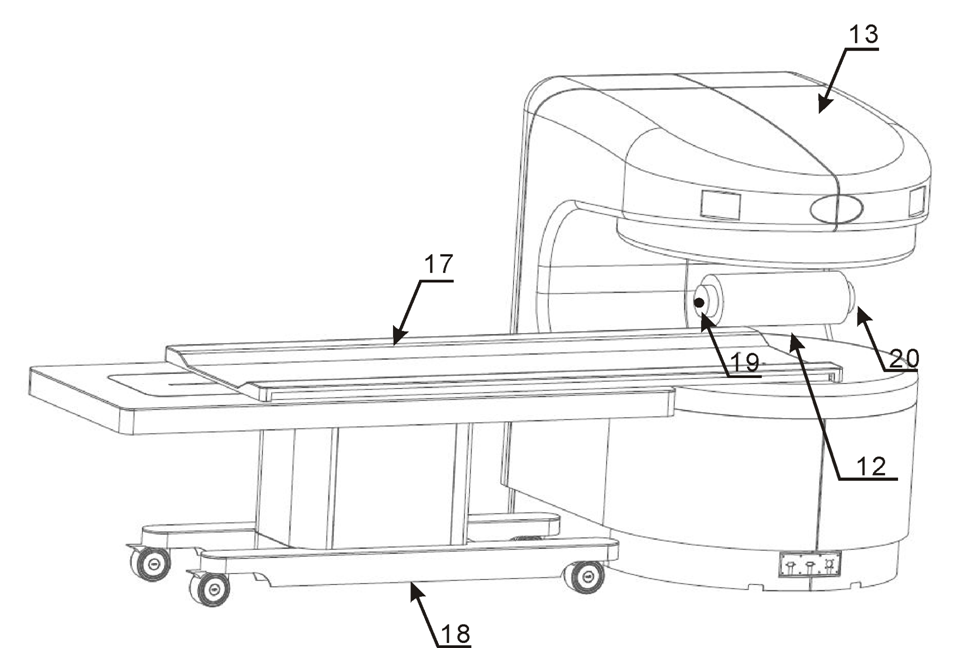
Figure 6 Figure 7
6. Nuclear magnetic resonance spectroscopy to measure the D-T2 oil saturation
This project uses simulation crude oil and formation water simulation to simulate the transport process crude oil in the ground, and at room temperature to simulate the diffusion coefficient of crude oil is much less than the diffusion coefficient of water 2 × 10⁻⁹m2 / s, can be on a two-dimensional spectrum both use a huge difference in the diffusion coefficient of the distinction. Select intermediate water diffusion coefficient value as the dividing line in the water on a two-dimensional spectrum, the diffusion coefficient is greater than the value of all the water signal signal signal diffusion coefficient is less than the value of all as the oil signal. Without adding any relaxation agent to obtain a good resolution of oil and water, see Fig 8.
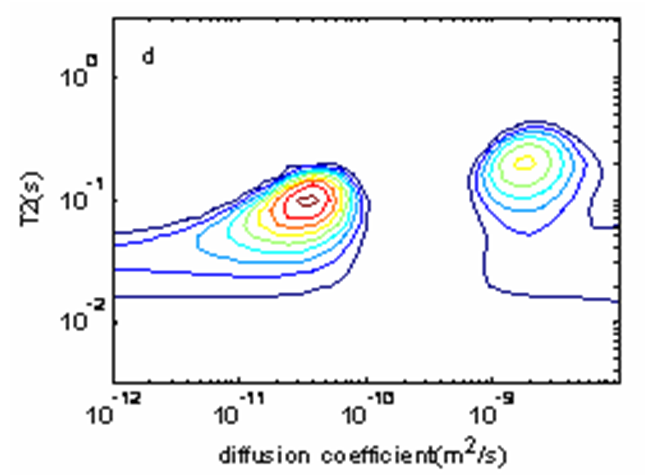
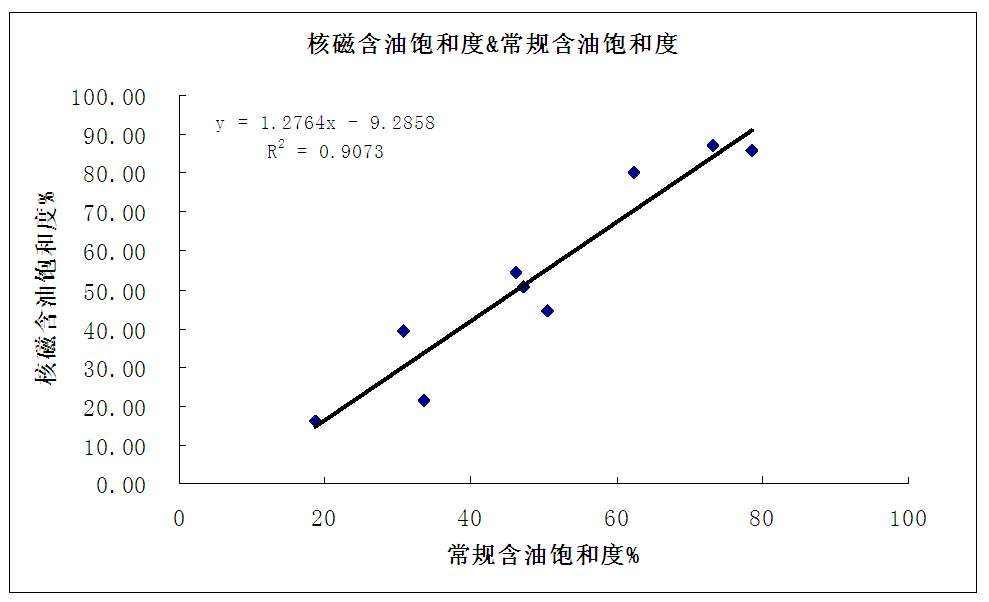
Figure 8 Figure 9